
As an Amazon seller, you know the struggle – with over 1.9 million rivals, standing out is no easy feat. But what if we told you there's a secret weapon that could skyrocket your sales? Yep, we're talking about Amazon Sales Analytics.
This bad boy is a bundle of powerful tools that give you a crystal-clear 360-degree view of your entire business. We're talking real-time data on everything from product performance to advertising campaigns.
And get this – using analytics effectively can boost your sales by a huge 15-25%. Now that's some serious money! The top Amazon sellers analyze over 20 key metrics across sales, advertising, inventory, pricing, you name it.
Properly utilized, analytics can be the compass that guides every strategic decision an Amazon seller makes. With insights like these at your fingertips, you can make smart decisions that'll have your profits multiplying.
Amazon Analytics & Its Role For Sellers
By leveraging analytics, sellers can make informed decisions that align with their business goals. Whether it's adjusting pricing strategies, managing inventory, or enhancing marketing efforts, analytics provide a foundation for these crucial decisions.
But, what exactly is Amazon analytics?
Simply put, it's the process of collecting, analyzing, and interpreting data related to your Amazon business. This data can cover everything from customer behavior and search trends to product performance and advertising metrics.
But Amazon analytics isn't just about crunching numbers – they offer insights that go beyond mere numbers, translating data into actionable intelligence. Analytics empower sellers to understand customer behavior, gauge product performance, identify market trends, and optimize their operations.
Here's a glimpse of what Amazon analytics can do for your business:
- Customer Insights: Get deep into customer demographics, search terms, and purchasing behavior to better understand your target audience and tailor your product listings and marketing efforts.
- Optimize Product Listings: Analyze data on conversion rates, click-through rates, and customer reviews to fine-tune your product listings, ensuring they resonate with your audience and drive sales.
- Refine Advertising Strategies: Leverage data on advertising performance, keyword effectiveness, and return on ad spend (ROAS) to optimize your campaigns and maximize your advertising budget.
- Streamline Inventory Management: Monitor sales trends, demand forecasts, and customer purchasing patterns to maintain optimal inventory levels, minimizing stockouts and overstocking.
- Identify Growth Opportunities: Discover emerging trends, popular product categories, and untapped markets, allowing you to stay ahead of the curve and capitalize on new opportunities.
But that's not all – Amazon analytics also empowers you to track your performance against competitors, monitor market basket analysis, and even identify cross-selling and upselling opportunities.
Impact Of Data-Driven Decision Making
The shift towards data-driven decision-making is not just a trend; it's a fundamental change in how Amazon sellers approach their business.
Decisions backed by data are more likely to yield positive outcomes, as they are based on actual customer interactions and sales performance:
| Strategy | Description | Impact |
|---|---|---|
| Inventory Forecasting | Adjusting stock levels based on sales data | Prevents stockouts/overstocking |
| Historical Data Analysis | Using past sales to predict future demand | Improves accuracy of inventory |
| Advanced Forecasting Models (like ARIMA) | Implementing algorithms by considering factors like rapid growth, seasonality, trends, and market dynamics. | Enhances prediction reliability |
| Market Research | Analyzing market trends and competitive analysis identifying demand patterns for their products. | Informs product and pricing strategies |
Through the strategic use of Amazon sales analytics, sellers can navigate the complexities of the marketplace more effectively.
Key Metrics (KPI) for Amazon Sellers
A KPI is a measurable value that shows how effectively a company is achieving key business objectives. Organizations use KPIs to evaluate their success at reaching targets.
Key Performance Indicators (KPIs) are quantifiable metrics that allow companies to track and analyze specific aspects of their performance over time. They provide concrete evidence of whether a business is on the right path toward meeting its goals.
Some examples to illustrate:
- For a sales team, KPIs could include revenue numbers, lead conversion rates, and average deal size. Tracking these shows if sales strategies are working.
- For a manufacturing company, KPIs may cover production output, equipment efficiency, and defect rates. This data reveals operational performance.
- For a website, relevant KPIs are visitor numbers, bounce rates, and conversion rates from traffic sources. These indicate marketing effectiveness.
So in simple terms, KPIs are the vital numerical metrics that companies closely watch and analyze to understand if they are hitting their most important performance targets or need to adjust strategies.
Advertising Metrics: Power of Amazon Ads
As an Amazon seller, mastering advertising metrics is crucial for maximizing your return on investment (ROI) and driving sustainable growth.
These metrics provide invaluable insights into the performance of your ad campaigns, enabling you to make data-driven decisions and optimize your strategies. Let's explore few key advertising metrics that every seller should understand.
1. Total Advertising Cost of Sales (TACoS)
This metric measures the overall impact of your advertising efforts on your total sales.
A lower TACoS percentage indicates higher profitability and efficiency in your advertising spend.
2. Return on Ad Spend (RoAS)
RoAS quantifies the revenue generated for every dollar invested in advertising.
A higher RoAS signifies that your ad campaigns are generating more revenue than the costs incurred, making them profitable.
3. Advertising Cost of Sale (ACoS)
ACoS evaluates the efficiency of your advertising expenditures against the sales made.
A lower ACoS suggests that your advertising dollars are driving sales more efficiently, while a higher ACoS may indicate a need for adjustments in targeting, keywords, or overall approach.
Here's a practical example to illustrate these metrics:
| Metric | Calculation | Value |
|---|---|---|
| Ad Spend | – | $1,000 |
| Ad Revenue | – | $5,000 |
| Total Revenue | – | $10,000 |
| TACoS | ($1,000 / $10,000) × 100% | 10% |
| RoAS | $5,000 / $1,000 | 5 |
| ACoS | ($1,000 / $5,000) × 100% | 20% |
In this scenario, your TACoS of 10% indicates that your advertising efforts are contributing positively to your overall sales profitability.
Additionally, your RoAS of 5 means that for every $1 spent on advertising, you're generating $5 in ad revenue, making your campaigns profitable. Finally, your ACoS of 20% suggests that your advertising dollars are driving sales efficiently.
4. Click-Through Rate (CTR)
This metric measures how often people who see your ad end up clicking it. A high CTR indicates that your ad is relevant and appealing to your target audience.
5. Add-to-Cart Rate
This tracks how many visitors add your product to their shopping cart. A higher rate can indicate that customers are seriously considering your product.
Its the percentage of visitors who add items to their shopping cart, indicating potential purchase intent.
Amazon Sales Analytics & Performance Metrics
As an Amazon seller, understanding and optimizing your sales and profitability metrics is crucial for driving sustainable growth and maximizing your earnings.
1. Revenue
This metric represents the total income generated from your sales activities on Amazon. It's a fundamental indicator of your business's financial health and growth trajectory.
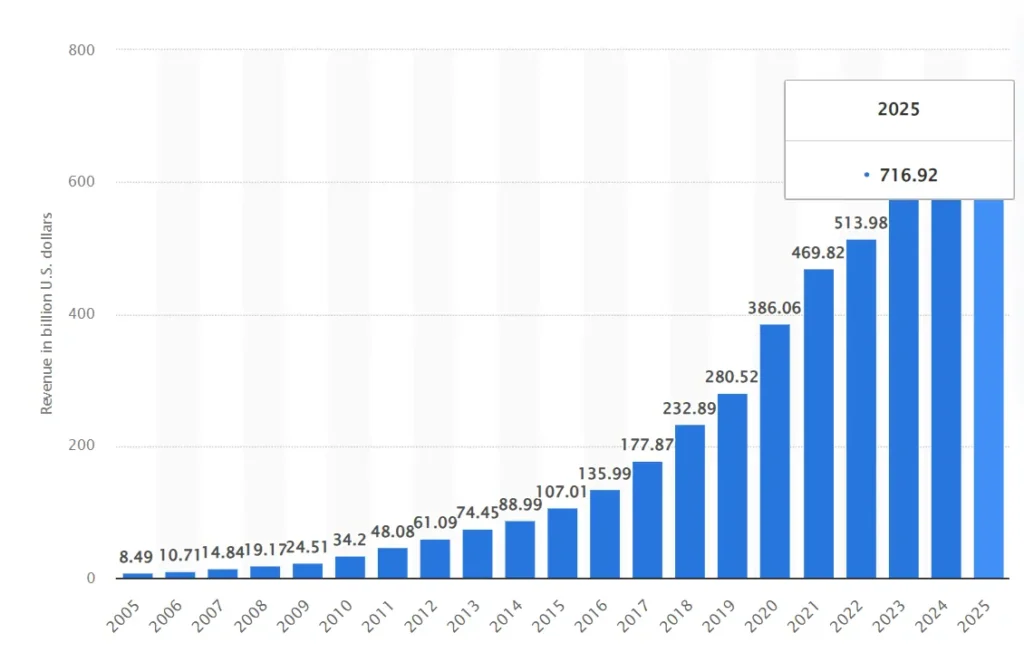
Tracking revenue over time can reveal valuable trends and patterns, enabling you to identify your best-selling products, peak seasons, and areas for improvement.
For example, if you notice a significant spike in revenue during a particular month, you can analyze the factors that contributed to this success, such as effective marketing campaigns or seasonal demand, and replicate those strategies to maintain consistent growth.
2. Conversion Rate
This metric measures the percentage of visitors to your product listings who ultimately make a purchase. A higher conversion rate often indicates effective product listings, competitive pricing, and a seamless customer experience.
– Imagine you had 1,000 visitors to your product listing last month, and 50 of them made a purchase.
Your conversion rate would be (50 / 1,000) × 100% = 5%.
By continuously optimizing your listings, addressing customer pain points, and leveraging Amazon's advertising tools, you can improve your conversion rate and drive more sales.
3. Average Order Value (AOV)
AOV represents the average amount spent per transaction by your customers. A higher AOV can significantly boost your profitability and revenue growth.
– Let's say your total revenue for the month was $10,000, and you received 500 orders. Your AOV would be $10,000 / 500 = $20.
By implementing strategies like product bundling, cross-selling, and upselling, you can encourage customers to add more items to their carts, increasing your AOV and overall profitability.
4. Algorithmic Forecasting Models (ARIMA)
.de30073e00c801b56d8b61a4c7812edd9798d1a0.png)
Advanced forecasting models, such as Autoregressive Integrated Moving Average (ARIMA), exponential smoothing, and machine learning algorithms, can provide more sophisticated and accurate demand predictions.
These models take into account various factors, including historical sales data, pricing adjustments, promotional activities, and even broader market trends.
| Forecasting Model | Description |
|---|---|
| ARIMA | Utilizes past data patterns to predict future demand, adjusting for seasonality and trends |
| Exponential Smoothing | Applies weighted averages to past data, giving more significance to recent observations |
| Machine Learning Algorithms | Analyzes large datasets to identify complex patterns and predict outcomes |
Sellers can benefit from employing these algorithmic models to anticipate future sales with greater precision, thereby optimizing inventory levels to meet customer demand without overcommitting resources.
Amazon Inventory Metrics To Manage Stock
As an Amazon seller, effectively managing your inventory is crucial for maximizing profitability and ensuring customer satisfaction.
1. Inventory Performance Index (IPI)
The IPI score ranges from 0 to 1000, with a higher score indicating better inventory management. A score above 550 is considered excellent, while a score below 450 may result in storage limitations imposed by Amazon.
To calculate your IPI score, Amazon considers four key factors:
- Excess Inventory %: The proportion of your inventory that has been in stock for an extended period, leading to higher storage costs.
- Stranded Inventory %: The percentage of your inventory that cannot be sold due to listing issues or policy violations.
- FBA Sell-Through Rate: The ratio of units sold to the average available inventory, reflecting your sales velocity.
- FBA In-Stock Rate: The percentage of time your popular products have been available for sale, ensuring customer satisfaction.
By optimizing these factors, you can improve your IPI score and unlock numerous benefits, such as increased storage limits, reduced fees, and enhanced product visibility on Amazon.
2. Sell-through Rate
This measures how quickly your inventory is sold and replenished within a specific period. A high rate indicates efficient inventory management, while a low rate may signal potential overstocking or stagnant sales.
3. Inventory Turnover Ratio
The Inventory Turnover Ratio measures how many times a company sells and replaces its inventory during a given period, typically a year. It indicates how efficiently a company manages its inventory.
- Where…
- Cost of Goods Sold is the direct costs associated with producing the goods sold during the period.
- Average Inventory = (Beginning Inventory + Ending Inventory) / 2
A high inventory turnover ratio indicates strong sales and efficient inventory management, as the company is able to quickly sell and restock its inventory. A low ratio may signal weak sales, overstocking, or obsolete inventory.
4. Avoiding Stockouts
As an Amazon seller, keeping a close eye on your stockout rate and FBA storage fees is crucial for maintaining a healthy business. A high stockout rate can lead to lost sales, dissatisfied customers, and long-term damage to your brand reputation.
A stockout occurs when you run out of inventory, leaving customers unable to purchase your products.
5. FBA Fees
On the other hand, Amazon charges FBA storage fees for the space your inventory occupies in their fulfillment centers. These fees are based on the daily average volume of your inventory, product size, and time of year.
To strike the right balance, consider implementing strategies like:
- Accurate Demand Forecasting: Utilize data-driven forecasting to anticipate demand and maintain optimal inventory levels.
- Inventory Management Tools: Leverage tools like FBA Cost calculator to monitor inventory age and estimate storage fees.
By proactively managing your stockout rate and FBA storage fees, you can minimize costs, ensure customer satisfaction, and maximize profitability on the Amazon marketplace.
6. Inventory Age
It tracks the average time your products spend in stock before being sold. Minimizing inventory age can help reduce storage costs and ensure your products remain fresh and relevant.
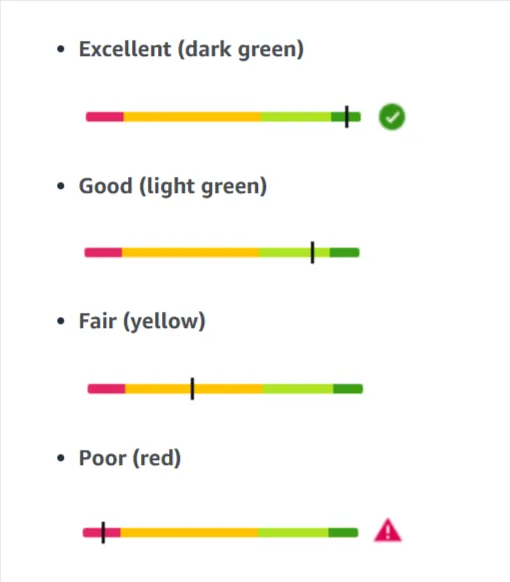
Amazon Account Health
Amazon calculates an Account Health Rating from 1 to 1000 for each seller account. A higher rating indicates better account health and compliance with Amazon's policies.
Maintaining a ‘Good' account health rating on Amazon is crucial. Failure to address policy violations promptly can result in your AHR dropping to ‘Critical' or ‘At Risk' levels, potentially leading to account deactivation.
To avoid such consequences, you need to diligently monitor six key account metrics, three of which are particularly critical:
- Order Defect Rate (ODR): This metric measures the percentage of orders that result in negative feedback, A-to-Z Guarantee claims, or chargebacks. Amazon's benchmark is to maintain an ODR below 1%.
- Pre-Fulfillment Cancel Rate: This rate tracks the percentage of orders you cancel before shipment. Amazon expects sellers to keep this rate below 2.5%.
- Late Dispatch Rate: This metric evaluates the percentage of orders with delayed shipping confirmations past the expected ship date. Sellers should aim for a rate below 4%.
In addition to these top three metrics, you should also closely monitor your customer service performance, policy compliance, and Valid Tracking Rate for shipments (target above 95%) to maintain a comprehensive view of your account health.
Market Penetration & Financial Health Metrics
While revenue and average order value (AOV) provide valuable insights, truly understanding your business's financial health requires a more comprehensive analysis.
1. Market Share represents your brand's sales as a percentage of the total sales within a specific product category or market. A higher market share indicates a stronger competitive position and brand recognition.
2. Category Rank reflects your product's performance and visibility within its respective category on Amazon. Improving your category rank can increase discoverability and drive more sales.Tracking these metrics can help you identify growth opportunities, assess your competitive positioning, and make informed decisions about product assortment and marketing strategies.
1. Gross Margin
Gross Margin is the percentage of revenue remaining after deducting the cost of goods sold (COGS). A higher gross margin indicates greater efficiency in controlling production costs and generating profits from core operations.
– For example, if your revenue is $100,000 and your COGS is $60,000, your gross margin would be ($100,000 – $60,000) / $100,000 x 100% = 40%.
2. Net Profit
Net Profit, on the other hand, represents your total earnings after accounting for all expenses, including overhead costs like marketing, rent, and salaries.
Tracking both gross margin and net profit can provide a comprehensive view of your profitability, allowing you to identify areas for cost optimization and operational improvements.
By monitoring these metrics, you can optimize your inventory levels, avoid stockouts or overstocking, and improve your overall operational efficiency.
Amazon Customer Metrics
As an Amazon seller, delivering exceptional customer experiences is paramount to your success. By mastering key customer metrics, you can gain valuable insights into your performance and identify areas for improvement. Let's explore some essential metrics that every seller should monitor.
1. Customer Acquisition Cost (CAC)
The CAC represents the average cost of acquiring a new customer. Monitoring your CAC can help you optimize your marketing and advertising strategies for cost-effectiveness.
2. Customer Retention Rate (CRR)
The CRR measures the percentage of customers who continue to make purchases from you over a specific period.
A high CRR indicates customer satisfaction and loyalty, reducing the need for constant customer acquisition efforts.
3. Customer Service Metrics
Prompt and effective customer service is crucial for building trust and loyalty. Key metrics to track include:
- Response Time: The average time it takes to respond to customer inquiries.
- Customer Satisfaction Rate: The percentage of customers who rate their service experience positively.
Aim for fast response times and high satisfaction rates to ensure a seamless customer experience.
4. Order Defect Rate (ODR)
The ODR measures the percentage of orders that result in negative feedback, A-to-Z Guarantee claims, or chargebacks.
Amazon's benchmark is to maintain an ODR below 1%. A high ODR can negatively impact your account health and seller rating.
5. Repeat Purchase Rate (RPR)
The RPR measures the percentage of customers who make repeat purchases from you within a given time frame.
A high RPR indicates customer loyalty and satisfaction with your products and services.
Buy Box Percentage
The Buy Box Percentage represents the number of times you own the Buy Box when customers view your listed product, divided by the total number of page visits for that listing.
– For example, if your product listing received 1,000 page views, and you owned the Buy Box for 200 of those views, your Buy Box Percentage would be (200 / 1,000) x 100% = 20%.
A higher Buy Box Percentage generally indicates a higher likelihood of making sales, as customers are more likely to purchase from the seller occupying the Buy Box.
Here's a quick overview of what a good Buy Box Percentage looks like:
| Product Category | Good Buy Box Percentage |
|---|---|
| Highly Competitive | 2% – 5% |
| Regular Products | 10% – 20% |
While a higher percentage is desirable, it's important to note that the Buy Box rotates among eligible sellers based on various factors, including pricing, fulfillment method, and seller performance metrics.
Exponential Growth With Amazon Analytics
As an Amazon seller, embracing analytics can propel your business to new heights, unlocking exponential growth and sustained success. In today's data-driven era, the choice is clear: either embrace analytics or risk falling behind.
The numbers speak for themselves: sellers who leverage Amazon's A+ Content Analytics experience a staggering 25% increase in conversion rates.
But that's just the tip of the iceberg. Effective utilization of advertising metrics like Return on Ad Spend (RoAS) and Advertising Cost of Sale (ACoS) can boost your campaign performance by up to 40%. With data-driven insights, you can fine-tune your advertising strategies, maximizing your return on investment and reaching your target audience with laser-precision.
The impact of analytics extends far beyond these examples. From customer retention to market penetration, data-driven decision-making has the potential to just change every aspect of your Amazon business.
Get 25% OFF on SmartScout
25% discount for first 3 months on any subscription plan