
Stop guessing on your Amazon product launch. Every year, 43% of sellers lose thousands because they skip essential data analysis before ordering inventory.
The difference between profitable FBA launches and expensive failures? Five data points that reveal competitor pricing patterns, keyword saturation levels, supply chain vulnerabilities, and conversion triggers most product research tools ignore completely.
Master these metrics, and you'll launch with the same intelligence top Amazon sellers use to dominate their niches.
Why These Amazon Product Launch Data Points Beat Basic Metrics

Most Amazon sellers make launch decisions based on basic metrics like sales volume estimates and review counts. That's like trying to find your way through the M25 with your eyes closed.
Real Amazon success comes from understanding the deeper market dynamics that aren't visible in standard product research tools. We're talking about competitor behaviour patterns, pricing volatility, keyword saturation levels, and conversion triggers that can make or break your launch.
The five data points we're about to explore are mission-critical intel that can save you from joining the 43% of Amazon sellers who fail within their first year.
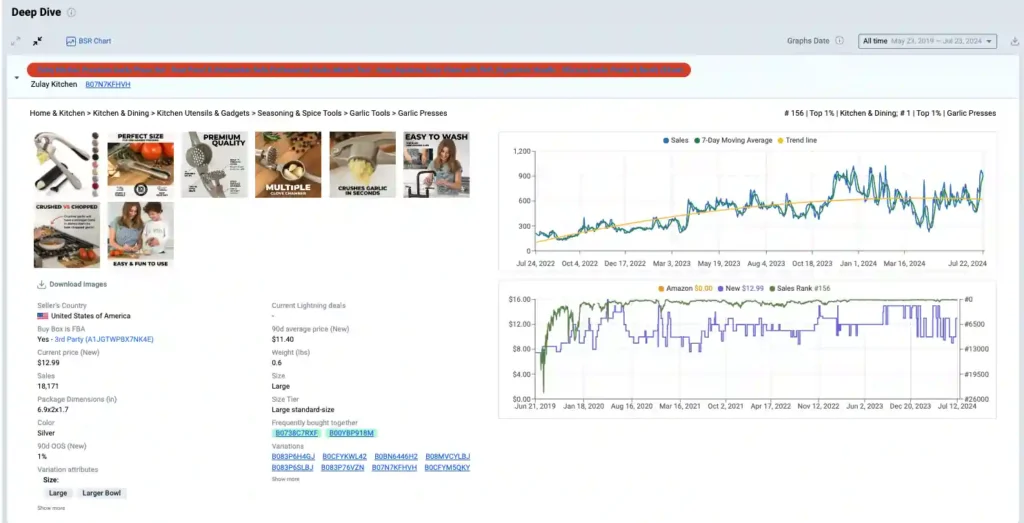
Historical Competitor Pricing (90-Day Average Price Trends)
This is where most sellers get absolutely hammered, and here's why.
You spot a product selling for $25 on Amazon, do a quick calculation, and think “Brilliant! I can compete at $23 and still make decent margins.” But what you don't see is that three months ago, that same product was selling for $18, and the current price is just a temporary spike.
Data Dive's historical pricing analysis reveals the true pricing battlefield you're entering. The 90-day average price trend shows you:
What to Look For:
I once saved a client from launching a kitchen gadget that appeared profitable at the current $28 price point. Historical data revealed the category had been in a pricing death spiral, dropping from $35 to $28 in just two months. Six weeks later, the average selling price hit $22.
Competitor Stock Stability (90-Day Out-of-Stock Analysis)
Nothing kills momentum like running out of stock, but here's what's even worse: launching into a category where your competitors can't keep products in stock.
This data point reveals supply chain vulnerabilities and demand volatility that standard research tools completely miss.
Data Dive's stock stability analysis tracks how often your competitors have been out of stock over the past 90 days, giving you insights into:
Key Metrics to Track:
| Stock Stability Level | Out-of-Stock Days (90d) | Launch Risk Assessment |
|---|---|---|
| Excellent | 0-5 days | Low risk – stable supply chains |
| Good | 6-15 days | Moderate risk – manageable |
| Poor | 16-30 days | High risk – supply chain issues |
| Dangerous | 30+ days | Avoid – chronic supply problems |
If competitors are frequently out of stock, it might signal opportunity rather than risk. But only if you've got a rock-solid supply chain and can maintain consistent inventory levels.
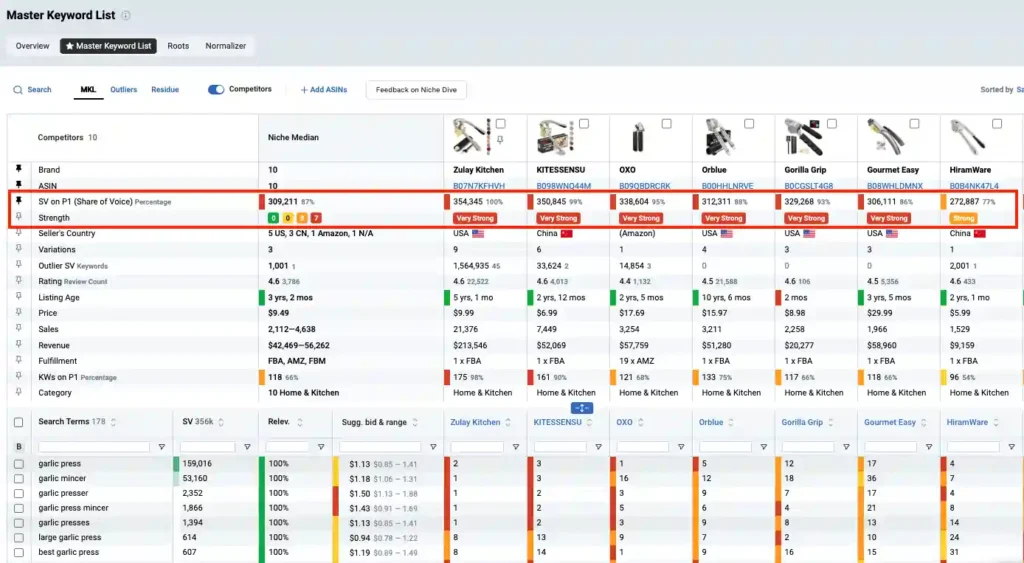
True Keyword Root Saturation (Master Keyword List Analysis)
This is the data point that separates the professionals from the weekend warriors.
Most sellers look at individual keywords and think they understand competition. But keyword root saturation analysis reveals the true competitive landscape by examining how thoroughly competitors have captured entire keyword families.
Data Dive's Master Keyword List (MKL) “Roots” report breaks down keyword competition at the root level, showing you:
Understanding Keyword Root Saturation:
Low Saturation
(Green Zone):
- Fewer than 5 strong competitors per keyword root
- Multiple ranking opportunities available
- Higher chance of organic growth
Medium Saturation (Amber Zone):
- 5-10 established competitors
- Requires strong PPC strategy and exceptional listing optimisation
- Moderate launch difficulty
High Saturation
(Red Zone):
- 10+ entrenched competitors
- Massive advertising budgets required
- High barrier to entry
I've seen sellers waste $15,000 on PPC campaigns trying to rank for keywords that were already dominated by 15+ established brands. The MKL analysis would have shown this wasn't a winnable battle from day one.
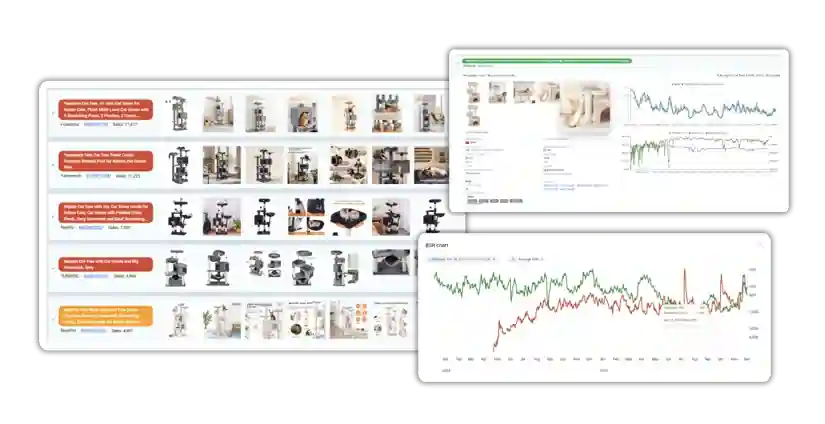
Competitor Image Strategy (Visual Conversion Analysis)
Your main image gets customers to click, but your entire image gallery gets them to buy. This data point is pure gold for optimising conversion rates before you even launch.
Data Dive's competitor image gallery analysis aggregates visual strategies from top-performing competitors, revealing:
What This Analysis Reveals:
Image Position Analysis:
Conversion Elements:
The insight here isn't just about copying what works – it's about identifying gaps in competitor visual strategies that you can exploit.
For instance, if every competitor uses sterile product shots, a lifestyle-focused gallery might give you a conversion advantage. Conversely, if everyone's going lifestyle-heavy, clean product demonstrations might cut through the noise.
PPC vs. Organic Correlation (Rank Radar Performance Data)
This is the most sophisticated data point on our list, and it's absolutely crucial for launch budget planning.
Most sellers either go all-in on PPC or try to rank organically from scratch. Both approaches often fail because they don't understand the symbiotic relationship between paid and organic performance in their specific niche.
Data Dive's Rank Radar reveals how PPC investment correlates with organic ranking improvements across different keyword groups, showing you:
Key Correlation Patterns:
High PPC Dependency:
- Organic ranks drop quickly when PPC spend decreases
- Indicates ultra-competitive keywords
- Requires sustained advertising investment
Moderate Correlation:
- PPC provides ranking boost but organic holds some position
- Balanced approach works best
- Can scale back PPC gradually after initial push
Low Dependency:
- Strong organic performance independent of PPC
- Content and SEO-focused strategy more effective
- PPC mainly useful for initial visibility boost
This data point prevents the classic mistake of budgeting $5,000 for launch PPC only to discover you need $15,000+ to maintain competitive rankings in your chosen niche.
How Data Dive Makes This Analysis Possible
Most Amazon tools give you snapshots. Data Dive delivers intelligence.
The platform pulls data from multiple sources—Amazon Seller Central, Brand Analytics, Google Trends, and Keepa—then correlates everything into actionable insights.
Key Data Dive Features for Launch Analysis
The ROI of Proper Analysis
Here's the maths: A failed product launch typically costs $5,000-15,000 in inventory, fees, and opportunity cost. Data Dive costs $39-490 per month. Even if it saves you from one bad launch decision, you've recouped years of subscription fees.
But the real value isn't avoiding failures—it's maximising successes. When you launch with complete market intelligence, you can:
Your Launch Success Blueprint
The difference between successful Amazon product launches and expensive failures often comes down to the quality of your pre-launch intelligence.
These five data points give you the insider knowledge that most sellers are flying blind without.
Data Dive makes accessing this critical intel possible, turning what used to be guesswork into data-driven decisions.
Don't be the seller who discovers these insights after losing thousands on a failed launch. Your competition certainly won't wait for you to catch up.
Ready to transform your product research process? Grab your Data Dive discount today and start making launch decisions based on real data instead of hope and guesswork.
Get 25% OFF on SmartScout
25% discount for first 3 months on any subscription plan