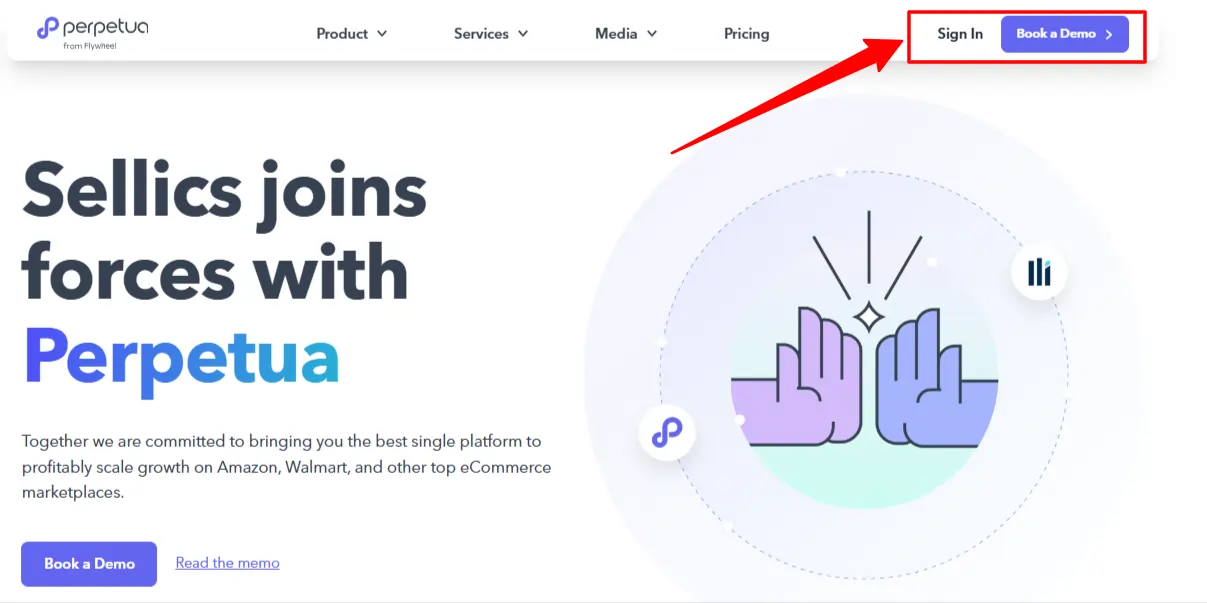
Sellics has recently joined forces with Perpetua, creating an even more strong platform for e-commerce growth.
Need a clearer picture of your profits?
Running a successful Amazon business requires meticulous tracking of various performance metrics. And Sellics Profit Dashboard is one such powerful feature that offers real-time insights into your Amazon business, helping you track sales, costs, and profits with ease.
In this guide, I will walk you through the steps on how to access the Sellics Profit Dashboard to track and optimize your Amazon business performance in 2026.
Let's get started! 🚀
What is the Sellics Profit Dashboard? 🤔
The Sellics Profit Dashboard is an extremely useful feature that provides real-time insight into the profitability of any Amazon seller. It integrates with any Seller Central account to provide relevant and up-to-date, accurate financial data. This dashboard calculates the true profit by deducting all costs to sales revenue, including Amazon fees, PPC spending, promotions, and item costs.
Refreshes occur every five minutes, so through this, sellers can track their exact profit margins and actually see the profitability of each SKU. Cost metrics are broken down in a user interface intuitive enough to identify the core drivers of profit and make data-driven decisions to optimize Amazon's business performance.
Key Features of Sellics Profit Dashboard
Why You Need to Track Your Amazon Performance?
Before we get into the nitty-gritty of the Sellics Profit Dashboard, let's talk about why tracking your Amazon performance is so important:
Now that you're convinced, let's explore how Sellics makes performance tracking a breeze. 😎
Connecting Your Amazon Seller Central Account
To get started with the Sellics Profit Dashboard, you first need to connect your Amazon Seller Central account. Don't worry, it's a piece of cake! 🍰
Sellics uses the Amazon API to pull in your sales, orders, fees, and other data in real time. That means you always have the most up-to-date information at your fingertips.
Exploring the Profit Dashboard
Now that your account is connected, it's time to get into the Profit Dashboard. Here's a quick overview of what you'll see:
| Section | Description |
|---|---|
| Overview | Key metrics like sales, costs, and profit for your selected date range. |
| Orders | Detailed breakdown of your orders, including fees and margins. |
| Costs | Breakdown of your costs, including product costs, shipping, and Amazon fees. |
| Profit | Calculation of your net profit after all costs are deducted. |
The dashboard is fully customizable, so you can adjust the columns and filters to see the data that matters most to you.
Analyzing Your Sales and Revenue
The first thing most sellers look at is their sales and revenue. Sellics makes it easy to see how much you're selling and earning over any time period.
In the Overview section, you'll see high-level metrics like:
You can click into the Orders section to see a detailed breakdown of each order, including:
This granular data is gold for analyzing your bestsellers, identifying trends, and spotting any issues with orders or fees.
Tracking Your Costs and Expenses
Knowing your revenue is only half the story. To calculate your true profitability, you also need a clear picture of your costs. Sellics breaks this down for you in the Costs section.
You'll see your costs split out into buckets like:
Having all your costs clearly laid out makes it easy to see where your money is going and find opportunities to cut expenses.
Calculating Your Profits
The ultimate goal of any business is to turn a profit. Sellics does the hard work of calculating your profitability for you, factoring in all your sales and costs.
In the Profit Section, You'll See Metrics like:
You can view your profit metrics for any date range and apply filters to drill down by marketplace, product, or brand. This helps you identify your most and least profitable products so you can optimize your portfolio.
Sellics also provides helpful visualizations of your profit data, like graphs showing your profit trend over time. This makes it easy to spot dips or spikes in profitability.
Utilizing Other Sellics Features for Deeper Insights
While the Profit Dashboard is the heart of performance tracking in Sellics, the tool offers many other features that provide deeper insights for growing your business. Here are a few key ones:
🔍 Product Research
🏷️ Listing Optimization
🛒 Inventory Management
📣 PPC Advertising
By combining the insights from the Profit Dashboard with these other tools, you can make smarter, data-driven decisions to scale your Amazon business.
Alternatives to Sellics Profit Dashboard
While Sellics is a popular choice for Amazon sellers, it's certainly not the only option out there. Here's how it stacks up against some key alternatives:
| Tool | Pros | Cons |
|---|---|---|
| Jungle Scout | Excellent product research and opportunity finder | The profit dashboard is not as advanced |
| Helium 10 | Powerful tools for listing optimization and keyword research | Higher learning curve and cost |
| AMZScout | Affordable pricing and easy to use | Fewer features compared to Sellics |
Ultimately, the right tool for you depends on your specific needs and budget. Sellics offers a good balance of features and usability for most sellers.
✅Tips for Making the Most of Sellics Profit Dashboard
To wrap up, here are some tips to help you get the most value out of the Sellics Profit Dashboard:
End Note
As an Amazon Seller, it's vital to keep up with your finances. Sellics Profit Dashboard is what's going to help you master your business on Amazon. It's not about knowing the numbers; it's about understanding them and how to use them to grow.
From a veteran seller to someone just starting, this feature will help in making more intelligent decisions on how to maximize profits. Sure, to be successful on Amazon is not just to sell but to be profitable.
So go ahead and take the Profit Dashboard for a spin.
Happy Selling! 🎉
Quick Links:
- Perpetua Review
- How To Access Perpetua Free Demo?
- Best Perpetua Alternatives
- Helium 10 vs Sellics (Perpetua)
Get 25% OFF on SmartScout
25% discount for first 3 months on any subscription plan